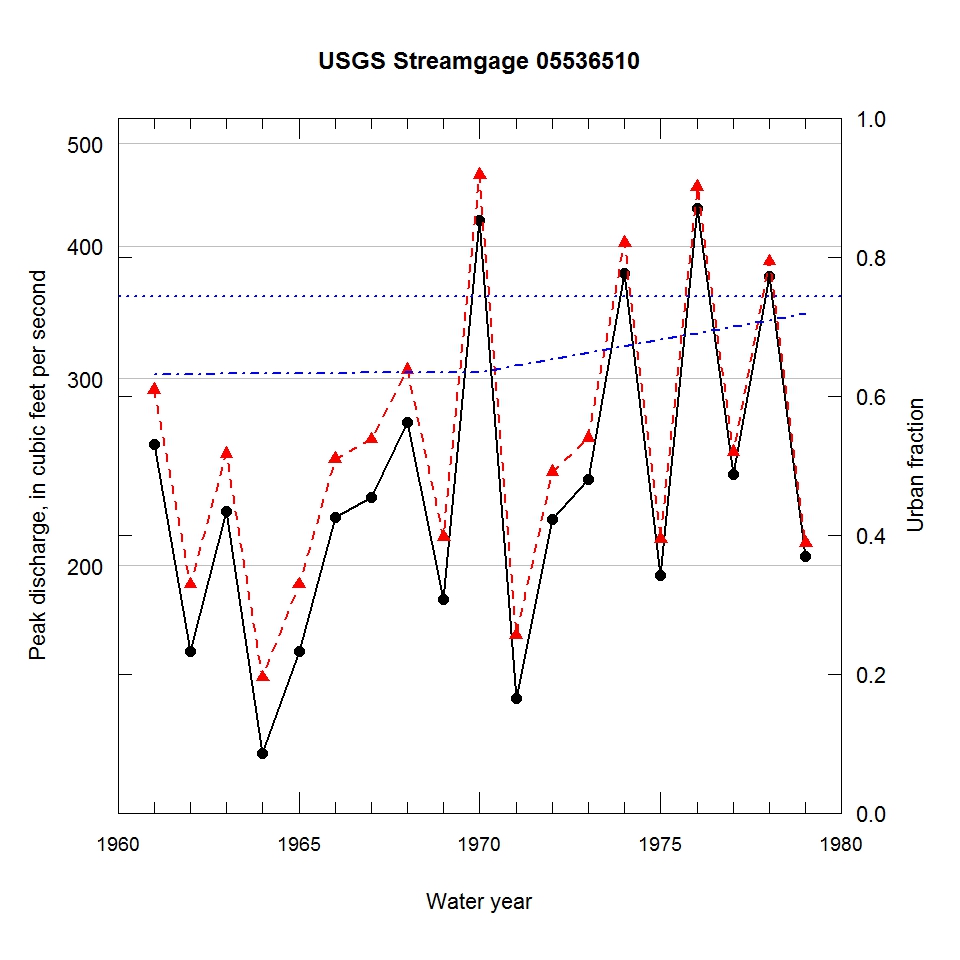
Observed and urbanization-adjusted annual maximum peak discharge and associated urban fraction and precipitation values at USGS streamgage:
05536510 NAVAJO CREEK AT PALOS HEIGHTS, IL


| Water year | Segment | Discharge code | Cumulative reservoir storage (acre-feet) | Urban fraction | Precipitation (inches) | Observed peak discharge (ft3/s) | Adjusted peak discharge (ft3/s) | Exceedance probability |
| 1961 | 1 | 2 | 0 | 0.631 | 1.428 | 260 | 293 | 0.393 |
| 1962 | 1 | -- | 0 | 0.631 | 0.277 | 166 | 192 | 0.758 |
| 1963 | 1 | -- | 0 | 0.632 | 1.543 | 225 | 255 | 0.522 |
| 1964 | 1 | -- | 0 | 0.632 | 0.737 | 133 | 157 | 0.869 |
| 1965 | 1 | -- | 0 | 0.633 | 0.899 | 166 | 192 | 0.759 |
| 1966 | 1 | -- | 0 | 0.633 | 1.332 | 222 | 252 | 0.534 |
| 1967 | 1 | -- | 0 | 0.633 | 1.150 | 232 | 263 | 0.497 |
| 1968 | 1 | -- | 0 | 0.634 | 1.382 | 273 | 306 | 0.349 |
| 1969 | 1 | -- | 0 | 0.634 | 0.420 | 186 | 213 | 0.684 |
| 1970 | 1 | -- | 0 | 0.635 | 1.118 | 423 | 467 | 0.092 |
| 1971 | 1 | -- | 0 | 0.644 | 0.933 | 150 | 172 | 0.822 |
| 1972 | 1 | -- | 0 | 0.653 | 1.208 | 221 | 245 | 0.558 |
| 1973 | 1 | -- | 0 | 0.663 | 1.314 | 241 | 264 | 0.492 |
| 1974 | 1 | -- | 0 | 0.672 | 1.141 | 377 | 403 | 0.157 |
| 1975 | 1 | -- | 0 | 0.681 | 1.068 | 196 | 212 | 0.689 |
| 1976 | 1 | -- | 0 | 0.691 | 0.977 | 434 | 455 | 0.100 |
| 1977 | 1 | -- | 0 | 0.700 | 1.436 | 244 | 256 | 0.518 |
| 1978 | 1 | -- | 0 | 0.709 | 1.086 | 375 | 387 | 0.175 |
| 1979 | 1 | -- | 0 | 0.719 | 0.853 | 204 | 210 | 0.695 |

